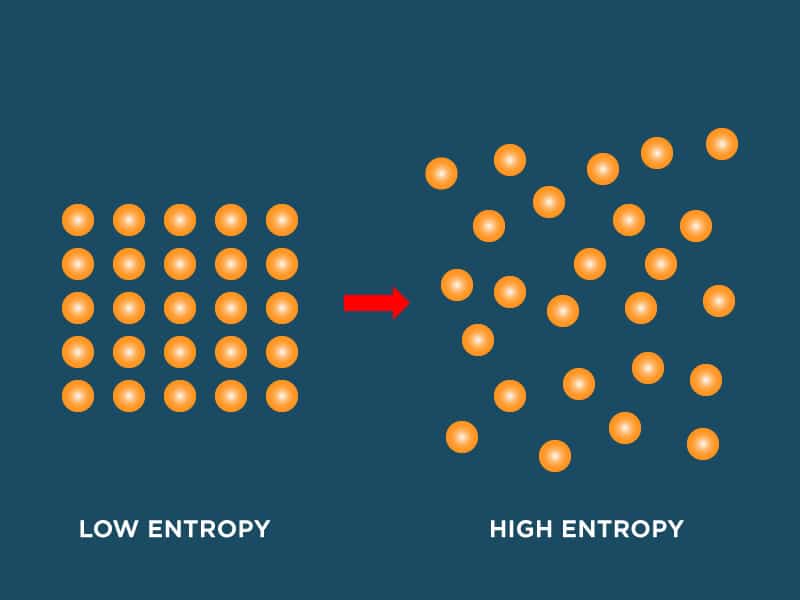
In physics, entropy quantifies the amount of disorder or randomness in a system.
Traditionally confined to thermodynamics, this principle finds a fascinating parallel in digital marketing.
As marketers, we often navigate a chaotic landscape filled with vast amounts of data, ever-changing consumer behaviors, and rapidly shifting trends.
Let’s explore a unique perspective connecting entropy and digital marketing, uncovering practical strategies to harness this apparent chaos for predictable success.
What is Entropy in Physics?
Before diving into digital marketing, let’s get a basic understanding of entropy.
Entropy is a measure of disorder or randomness within a system.
According to the second law of thermodynamics, the total entropy of an isolated system can never decrease over time.
This means systems naturally evolve towards a state of maximum disorder unless acted upon by an external force.
Digital is a Chaotic Ecosystem
Digital systems, like a physical system, tends towards disorder.
With strategic interventions, marketing efforts can become cohesive and efficient.
Data can often seem chaotic and unpredictable. This is where understanding entropy becomes crucial.
Imagine the flood of data generated from millions of social media interactions, website visits, email opens, and online purchases every day.
This data can be overwhelming and appear random, much like a physical system that tends toward disorder, or entropy.
Finding Patterns in Data with Entropy
As mentioned above, one of the biggest challenges in digital marketing is making sense of vast amounts of data and it’s becoming easier with AI powered SaaS tools taking less time as well.
By analyzing the entropy of data sets, marketers can identify patterns and trends within the apparent randomness.
For instance, engagement metrics from various social media platforms might seem disorderly.
However, calculating the entropy of these data sets can pinpoint which platforms and content types generate the most consistent engagement.
Entropy in Consumer Behavior
Consumers are unpredictable, and their preferences can change rapidly on how marketers, and social, economic situations influence them emotionally, contributing to the overall entropy of the market.
By understanding the entropy of consumer behavior, marketers can better predict shifts in preferences and trends.
This proactive approach allows for agile marketing strategies that quickly respond to changes, maintaining a competitive edge.
Examples of Entropy in Marketing
Netflix’s Personalized Recommendations
Netflix uses data entropy to manage the randomness of viewer preferences.
By analyzing viewing data, Netflix’s recommendation algorithm identifies patterns, reducing entropy by providing personalized content and significantly increasing user engagement and satisfaction.
Coca-Cola’s “Share a Coke” Campaign
Coca-Cola’s “Share a Coke” campaign reduced entropy in consumer behavior by personalizing products with common names. This strategy made the product feel unique to each individual, leading to increased sales and customer loyalty.
Amazon’s Targeted Marketing
Amazon uses machine learning algorithms to analyze customer data and reduce the entropy of purchasing behavior. By providing personalized product recommendations, Amazon ensures relevant marketing messages, significantly increasing conversion rates and customer satisfaction.
How to Calculate Entropy for Marketing Insights
Marketers can calculate the entropy of their data sets to gain valuable insights.
Here’s a how to do it,
Collect Data: Gather data from various sources, such as website traffic, social media engagement, email open rates, and conversion rates.
Choose a Metric: Select a specific metric to analyze, such as bounce or engagement rates.
Calculate Probability: Determine the probability of each event occurring within your data set.
Apply the Entropy Formula: Use the entropy calculator below.
Interpret the Results: A higher entropy value indicates more randomness, while a lower value suggests more order and predictability.
Example Calculation
Suppose you analyze engagement data from a social media platform:
- Likes: 300
- Comments: 150
- Shares: 50
- Total engagements: 500
Probabilities
- plikes = 300/500 = 0.6
- pcomments = 150/500 = 0.3
- pshares = 50/500 = 0.1
Entropy calculation
H = −(0.6log20.6 + 0.3log20.3 + 0.1log20.1)Using logarithm values
𝐻 = −(0.6 × −0.737 + 0.3 × −1.737 + 0.1 × −3.322) 𝐻 = −(−0.4422 − 0.5211 − 0.3322) 𝐻 = 1.2955A tool to calculate the entropy of a data set
You can use the following tool to input probabilities and calculates the entropy based on the provided probabilities.
How to use the Entropy Calculator?
What is the Entropy Calculator?
The entropy calculator is a tool that helps you measure the amount of disorder or randomness in a set of data.
In digital marketing, it can be particularly useful to understand the variability in your social media engagement or website traffic.
By calculating the entropy of your data, you can determine how predictable or chaotic your audience’s behavior is, which can help you refine your marketing strategies.
What Kind of Data to Enter?
To use the entropy calculator, you need to enter probabilities. Probabilities are numbers between 0 and 1 that show the likelihood of different events happening. Here’s what you need to do:
List Your Events
Think of the different events you want to analyze. For example, you might want to know the probabilities of different types of user interactions on your website (e.g., page views, clicks, conversions).
Calculate Probabilities
Determine the probability of each event happening. For example, if you think there’s a 50% chance of a user viewing a page, a 30% chance of clicking a link, and a 20% chance of converting, you’ll use these probabilities:
- Page View: 0.5
- Click: 0.3
- Conversion: 0.2
How to Enter Data?
- Open the Calculator: Use the entropy calculator by entering your data into the provided input field.
- Format Correctly: Enter the probabilities as comma-separated values. For the example above, you would type: 0.5, 0.3, 0.2
- Submit the Data: Click the “Calculate Entropy” button to see the result.
How to understand the Result?
Once you submit your probabilities, the calculator will give you a number called “entropy.” Here’s how to understand it:
High Entropy: If the number is high, it means there’s a lot of disorder or randomness in your data. The events are very unpredictable. For example, if you have high entropy in your social media engagement, it means user interactions are highly varied and there’s no clear pattern.
Low Entropy: If the number is low, it means there’s less disorder and more predictability. The events are more consistent. For example, if you have low entropy in your website traffic, it means user behavior is consistent and there’s a clear pattern.
Example Walkthrough
Social media platforms generate vast amounts of data through user interactions such as likes, comments, shares, and views. These interactions can vary significantly over time, making it challenging to identify consistent patterns or trends.
Step-by-Step Process to Calculate Entropy Over a Period
- Data Collection: Gather data on social media interactions over a specific period. For example, you might collect daily data on likes, comments, shares, and views for one month.
- Segment the Data: Break down the data into meaningful time intervals. For instance, you could segment the data by week to observe changes over each week of the month.
- Calculate Probabilities: For each time segment, calculate the probability of each type of interaction. Probabilities are calculated by dividing the number of specific interactions by the total number of interactions.
- Compute Entropy for Each Segment: Use the entropy formula to calculate the entropy for each time segment. This will give you an entropy value that reflects the level of disorder in the interactions for each period.
Practical Example
Let’s say you are analyzing the social media interactions for your brand’s Facebook page over four weeks. Here’s how you could approach it,
Analyzing Social Media Interaction Entropy
| Week | Likes | Comments | Shares | Total Interactions | Entropy |
|---|---|---|---|---|---|
| Week 1 | 300 | 150 | 50 | 500 | 1.29 |
| Week 2 | 250 | 200 | 100 | 550 | 1.52 |
| Week 3 | 400 | 100 | 50 | 550 | 0.95 |
| Week 4 | 320 | 150 | 80 | 550 | 1.34 |
By analyzing the entropy values over these four weeks, you can identify periods of high and low unpredictability in user interactions, helping to inform your marketing strategies.
Interpreting the Results
By calculating the entropy for each week, you can observe how the disorder or randomness in your social media interactions changes over time. Here’s what the results might indicate:
- Week 1 (Entropy: 1.29): Moderate level of disorder. User interactions are somewhat predictable.
- Week 2 (Entropy: 1.52): Higher level of disorder. User interactions are more varied and less predictable.
- Week 3 (Entropy: 0.95): Lower level of disorder. User interactions are more consistent and predictable.
- Week 4 (Entropy: 1.34): Moderate level of disorder. Similar to Week 1, indicating some predictability but still varied.
Applying the Insights
By understanding the entropy of your social media interactions, you can make more informed decisions about your marketing strategies:
- High Entropy Periods: During weeks with high entropy, consider focusing on more personalized and targeted content to reduce randomness and increase engagement consistency.
- Low Entropy Periods: During weeks with low entropy, analyze what strategies or content worked well to replicate and scale those efforts across other periods.
Tracking social media ‘randomness’ over time helps us see patterns. “This ‘messy’ data lets us build better marketing plans that grab attention and get results for our clients even when 70% of clients of Meta and Google say advertising is not profitable for them. Just like how the 20% are making a profit it comes down to data-driven solutions and optimizing multiple touch points to reengage people to your products or services.
By understanding and using the entropy calculator, you can get a better grasp of how varied or consistent your digital marketing data is. This can help you make informed decisions about where to focus your efforts to improve engagement and conversions.
Entropy Calculator
Using Google Analytics and Social Media Insights
Tools like Google Analytics and Social Media Insights provide a wealth of data that can be analyzed using entropy. Marketers can uncover hidden patterns and optimize their strategies by applying entropy calculations to metrics like bounce rate, session duration, and social media engagement.
Google Analytics Example
- Bounce Rate: Calculate the entropy of bounce rates across different traffic sources to identify which sources are more stable and which are more random.
- Session Duration: Analyze the entropy of session durations to understand user engagement and make data-driven decisions to improve website content.
Social Media Insights Example
- Engagement Rates: Calculate the entropy of engagement rates (likes, comments, shares) to identify the most consistent and unpredictable content types.
- Audience Demographics: Use entropy to analyze the diversity of your audience demographics and tailor your marketing messages accordingly.
Reducing Entropy Through Personalization
One effective method of reducing entropy in digital marketing is personalization. Personalized marketing strategies aim to deliver tailored content and offer to individual consumers, reducing randomness and increasing predictability.
Machine Learning and AI
Machine learning algorithms and AI analyze consumer data to identify patterns and preferences, enabling marketers to create highly targeted campaigns. This enhances marketing efficiency and improves customer satisfaction and loyalty. If you are not already using AI to add value to your strategies it’s high time you start now!
Implementing Entropy Insights into Marketing Strategies
Once you have calculated the entropy, use these insights to refine your marketing strategies:
- High Entropy: Indicates a high level of randomness. Focus on more personalized and targeted content to reduce entropy and increase engagement predictability.
- Low Entropy: Suggests more predictable engagement. Leverage this stability to scale successful campaigns and replicate strategies across different channels.
Actionable Steps
Segment Your Audience: Use entropy insights to segment your audience based on engagement patterns and preferences.
Tailor Your Content: Develop content that resonates with each segment, reducing randomness and increasing relevance.
Optimize Campaigns: Monitor and adjust your campaigns based on entropy calculations to maintain high engagement and conversion rates.
Future of Digital Marketing
As digital marketing evolves, embracing the concept of entropy can lead to more innovative and effective strategies.
Marketers must recognize the inherent disorder in the digital landscape and leverage it to their advantage.
By understanding and managing entropy, they can create order from chaos, turning unpredictability into a strategic asset.
Emerging Technologies
Technologies like AI, machine learning, and big data analytics will be crucial in managing entropy.
These tools enable marketers to analyze vast amounts of data, identify patterns, and make data-driven decisions that enhance campaign effectiveness and customer satisfaction.
Conclusion
The concept of entropy offers a unique lens through which to view digital marketing. Our team at HypeX Digital Marketing Agency did a brainstorming session and wanted to try it out, and here we are writing an article about it for you because understanding the unpredictability, or entropy, of your digital marketing data can provide significant insights that help refine and enhance your marketing strategies.
By acknowledging the natural tendency towards disorder and implementing strategies to manage it, marketers can navigate the complexities of the digital world with greater precision and success.
As we explore the intersections of physics and marketing, we uncover new opportunities to enhance our understanding and effectiveness in an ever-changing landscape.
FAQs
1. Does the concept of entropy need to be more abstract for practical application in marketing?
While entropy might seem abstract, its principles can be practically applied to marketing. Marketers can identify patterns and make data-driven decisions by measuring the randomness in consumer behavior and data. Although it requires a conceptual leap, the insights gained from understanding entropy can significantly improve marketing strategies.
2. How reliable is entropy as a tool for predicting consumer behavior?
Entropy is one tool among many for understanding consumer behavior. It’s not a silver bullet, but it offers valuable insights into your data’s unpredictability level. When combined with other analytical methods, entropy can help create a more comprehensive view of consumer behavior and improve predictability.
3. Isn’t calculating entropy too complex for the average marketer?
Calculating entropy does involve some mathematical complexity, but there are tools and software that simplify this process. Additionally, marketers can collaborate with data analysts to interpret entropy calculations. The key is to focus on the insights rather than getting bogged down in the math.
4. Can entropy analysis provide actionable insights, or is it just another data metric?
Entropy analysis can provide actionable insights by highlighting areas of high unpredictability in your marketing data. For example, suppose your social media engagement has high entropy. In that case, you can focus on creating more targeted and personalized content to reduce this randomness. It’s a valuable metric that, when interpreted correctly, can guide strategic decisions.
5. Aren’t there more straightforward methods to analyze marketing data without resorting to entropy?
Yes, more straightforward methods exist to analyze marketing data, such as trend analysis and segmentation. However, entropy offers a unique perspective by quantifying the level of disorder and unpredictability in your data. It complements traditional methods and provides deeper insights, especially in complex and dynamic marketing environments.